Intellectual Property Rights at the JPO: Statistics (2019)
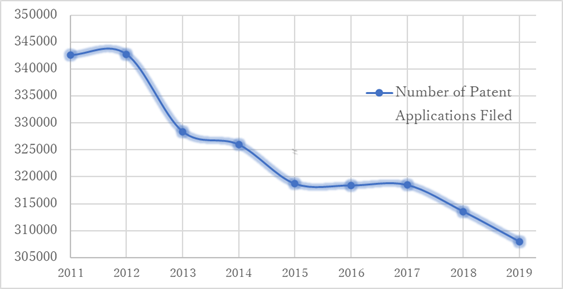
FIG. 1. Number of patent applications filed
at the JPO per calendar year. Since 2011, there has been an 11% decrease in the
number of patent applications filed at the JPO.
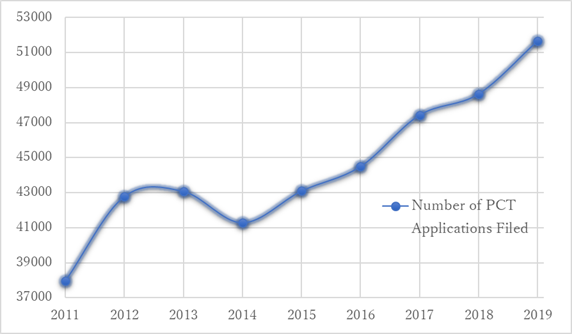
FIG. 2. Number of applications filed under
the PCT at the JPO per calendar year.
In 2019, the number of PCT applications filed
with the JPO increased by 6.2% to 51,652 applications compared to 2018. The
number of PCT applications filed at the JPO has steadily increased by over 36%
since 2011.
The average time until a First Action (FA)
was issued (pendency) for a patent application at the JPO has remained relative
stable over the past 5 years and was 9.3 months in 2019. The total
pendency which is the time from the request for examination until the
application reaches a final disposition (or is withdrawn, etc)
was 14.1 months.
The number of International Search Reports
(ISR) produced by the JPO increased from 40,529 in 2012 to 51,666 in 2019.
|
2014 |
2015 |
2016 |
2017 |
2018 |
2019 |
|
|
Decision to Grant Patent |
205,711 |
173,015 |
191,032 |
183,919 |
177,852 |
167,945 |
|
Number of FAs |
255,001 |
235,809 |
246,879 |
239,236 |
232,701 |
227,293 |
Table 1: Number of granted patents and first
office actions (FA) at the JPO. The number of granted patents and the number of
FAs issued have dropped by about 18% and 11% respectively since 2014. This may
be due to the general decline in applications filed at the JPO and the influx
of new examiners at the JPO.
|
2014 |
2015 |
2016 |
2017 |
2018 |
2019 |
|
|
Applications Filed by Foreign Applicants (%) |
18.4 |
18.7 |
18.3 |
18.3 |
19.1 |
20.3 |
|
Number of Patent Registrations (x1000) |
227 |
189 |
203 |
199 |
194 |
180 |
Table 2: Percent of patent applications filed
by foreign applicants and total number of patent registrations (in thousands)
at the JPO.
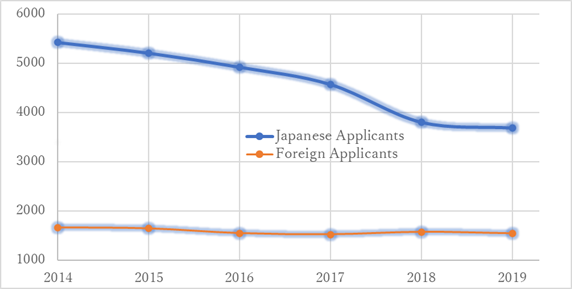
FIG. 3. Number of Utility Model applications
filed at the JPO by Japanese and foreign applicants. Since 2014, the number of
Utility Model applications filed by Japanese applicants has been gradually
decreasing while the number of Utility Model applications filed by foreign
applicants has remained relatively stable.
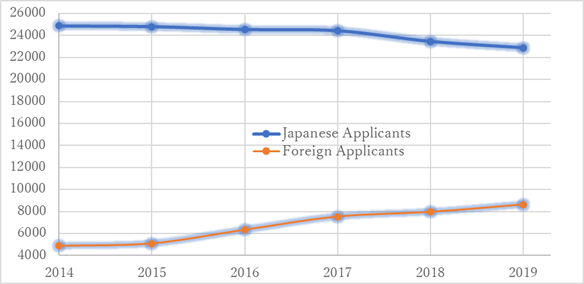
FIG. 4. Number of applications for Design
Registration filed at the JPO by Japanese and foreign applicants. The
percentage of foreign applicants filing for Design Registration at the JPO has been
steadily increasing from 2014, particularly from 2015. As the JPO began to
accept International Design applications under the Hague Agreement in May 2015,
this increase is not surprising.
The
average time until a First Action (FA) was issued (pendency) for a design
application at the JPO was 6.2 months in 2019. The total pendency which
is the time from the request for examination until the design application
reaches a final disposition (or is withdrawn, etc)
was 7.0 months.
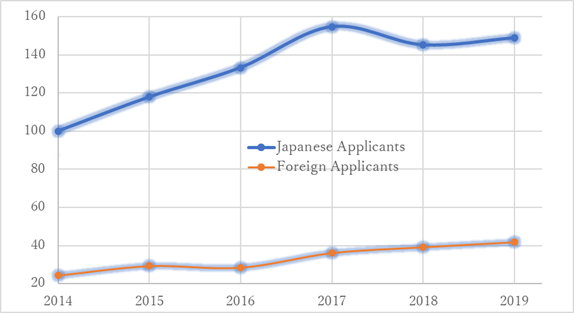
FIG. 5. Number of Trademark applications
filed at the JPO by Japanese and foreign applicants and the average pendency of
the application. The number of applications is displayed in units of 1,000. The
number of Trademark applications filed by Japanese applicants has been steadily
increasing in recent years. The number of Trademark applications filed by
foreign applicants has steadily increased from about 24,389 in 2014 to 41,820
in 2019.
The
average time until a First Action (FA) was issued (pendency) for a trademark
application at the JPO was 7.9 months in 2019. The total pendency which
is the time from the request for examination until the trademark application
reaches a final disposition (or is withdrawn, etc)
was 9.3 months.
Trials and Appeals
The
number of appeals against an examiner’s decision of refusal for a patent
application has declined from 25,709 requests in 2014 to 16,699 requests in
2019. Since 2014, the number of requests for appeal against an examiner’s
decision of refusal for a trademark application has been between 514 and 855
cases. The number of requests for an appeal against an examiner’s decision of
refusal for a design application has remained between 300-400 cases per year
since 2012.
Requests for Trials for Invalidation and
Oppositions
Between
2006-2015, the number of requests for a trial for invalidation of a patent had
remained within the range of 217 and 292 cases per year, however since 2016,
the number of requests has fallen to between 112 to 161 such requests. Since
2011, approximately 50% of the appeals against an examiner’s decision of
refusal have been accepted.
The
number of requests for a trial for invalidation of a utility model has been ten
or fewer per year since 2008. The number of requests for a trial for
invalidation of a design registration has been less than 30 since 2008. Lastly,
the number of requests for a trial for invalidation of a trademark registration
has remained within a range of 88 to 140 per year since 2014.
Since
2010, approximately 430 oppositions to a trademark registration have been filed
each year. In 2015, accompanying the adoption of a new patent opposition system
by the JPO, opposition filings have soared from 364 in 2015 to between 1,073
and 1,251 cases per year. Additionally, after a surge in 2015, the number of
Advisory Opinions (Hantei) requested has decreased to
36 in 2016 and only 21 Hantei requests were made in
2019.
Ex-parte appeals include appeals against an examiner’s
decision of refusal, appeals against an examiner’s ruling to dismiss
amendments, and trials for correction. The number of ex-parte
appeals decreased to 4 for trademarks, remained at 4 for designs, and remained
relatively unchanged for patents and utility models (23 cases).
Inter-partes trials include trials for invalidation and trials
for rescission. Inter-partes trials for patent and
utility models decreased by 23% compared to 2018, and 2 inter-partes trials for designs and 28 inter-partes trials
for trademarks were conducted in 2019.
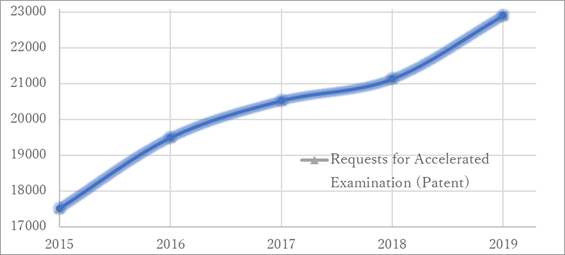
Fig. 6. Change in the number of requests for
accelerated examination. There has been a continuous upward trend in the number
of accelerated examinations requested since 2015. Patent applications,
trademark applications (8110 cases, a 54% increase from 2018) and design model
applications (218 cases) for which accelerated examination was requested had an
average first action pendency of 2.5, 1.7, and 1.7 months respectively in 2019.
Super-accelerated patent examinations (1125 such requests in 2019) had an
average first action pendency of 0.6 months (1.3 months for DO applications) in
2019. Accelerated examination is available for applications which meet certain
criteria summarized here.
|
July – December 2019 |
All Applications |
National PPH |
PCT PPH |
|
Patent Grant (%) |
75 |
81 |
92.7 |
|
First Action Allowance (months) |
14.2 |
19.8 |
43.4 |
|
Pendency PPH request to First
Action(months) |
9.4 |
2.6 |
2.8 |
|
Pendency PPH request to Final
Decision (months) |
14.3 |
7.3 |
5.3 |
|
Number of Office Actions |
1 |
1 |
0.7 |
Table 3: Patent Prosecution High Requests and
Examination Results.
For the 6-month period from July 2019 until
December 2019, comparative data regarding national phase PPH applications,
PTC-PPH applications, and all applications submitted to the Japan Patent Office
Non-Traditional Trademarks
In April 2015, the Japan Patent Office began
to accept non-traditional trademark applications. These applications include
color, sound, position, motion, and holograms, as well as regional collective
trademarks. Since the start of the program over 2000 non-traditional trademark
applications have been submitted to the JPO and more than 500 non-traditional
trademarks have been registered. More than 1,300 applications for regional
collective trademarks were filed by the end of 2019. More information regarding
non-traditional trademarks and regional collective trademarks can be found here.
Collective Examinations for IP Portfolios
(summarized in detail here)
In 2019, 39 applications for collective
examination (including applications for patents, trademarks, and designs filed
together) were filed at the JPO.
Utilization of New Broad Classification Codes
In order to better classify inventions
related to IoT which may span multiple fields, the JPO created a series of new
classifications (Steps taken by the JPO as well as the Japanese government,
organizations and industry to prepare for the influx of IoT-related
applications can be found here). In July 2019, the IPC
classification code G06N was assigned to inventions deemed to be AI-core
inventions and a new IPC classification code G16Y for IoT-technology entered
into force in January 2020.
All of the above statistical information was
obtained from the JPO and WIPO and was culled from numerous reports on the
state of Intellectual Property at various patent offices throughout the world.